
Page 39 - 4749
P. 39
l l
к 0 100%, (2.25)
l
0
where l – length of the sample after the break;
к
- relative residual narrowing of % :
A A
0 K 100%, (2.26)
A
0
where A – cross sectional area in a crack of the sample.
К
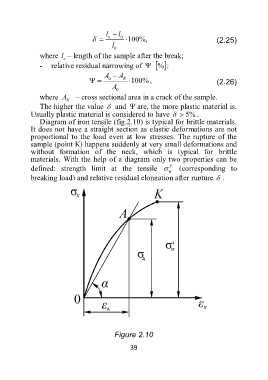
The higher the value and are, the more plastic material is.
Usually plastic material is considered to have 5% .
Diagram of iron tensile (fig.2.10) is typical for brittle materials.
It does not have a straight section as elastic deformations are not
proportional to the load even at low stresses. The rupture of the
sample (point К) happens suddenly at very small deformations and
without formation of the neck, which is typical for brittle
materials. With the help of a diagram only two properties can be
Р
defined: strength limit at the tensile (corresponding to
м
breaking load) and relative residual elongation after rupture .
Figure 2.10
39