
Page 37 - 4749
P. 37
To obtain quantitative estimates of material properties the
l
machine diagram С is rebuilt in the diagram by
x x
dividing the force P into the initial cross-sectional area A and
0
elongation of the sample l into its original length l .
0
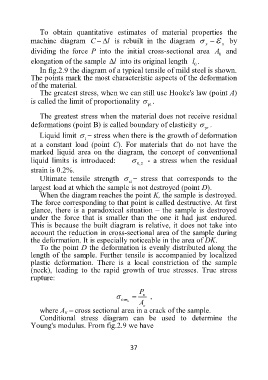
In fig.2.9 the diagram of a typical tensile of mild steel is shown.
The points mark the most characteristic aspects of the deformation
of the material.
The greatest stress, when we can still use Hooke's law (point A)
is called the limit of proportionality .
pt
The greatest stress when the material does not receive residual
deformations (point B) is called boundary of elasticity .
pr
Liquid limit – stress when there is the growth of deformation
t
at a constant load (point C). For materials that do not have the
marked liquid area on the diagram, the concept of conventional
liquid limits is introduced: - a stress when the residual
0,2
strain is 0.2%.
Ultimate tensile strength – stress that corresponds to the
st
largest load at which the sample is not destroyed (point D).
When the diagram reaches the point K, the sample is destroyed.
The force corresponding to that point is called destructive. At first
glance, there is a paradoxical situation – the sample is destroyed
under the force that is smaller than the one it had just endured.
This is because the built diagram is relative, it does not take into
account the reduction in cross-sectional area of the sample during
the deformation. It is especially noticeable in the area of DK.
To the point D the deformation is evenly distributed along the
length of the sample. Further tensile is accompanied by localized
plastic deformation. There is a local constriction of the sample
(neck), leading to the rapid growth of true stresses. True stress
rupture:
P
к ,
іст к
A
к
where А к – cross sectional area in a crack of the sample.
Conditional stress diagram can be used to determine the
Young's modulus. From fig.2.9 we have
37