
Page 45 - 6685
P. 45
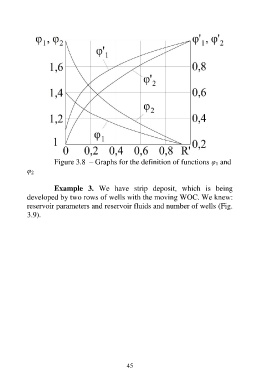
Figure 3.8  – Graphs for the definition of functions φ 1 and
          φ 2

                  Example  3.  We  have  strip  deposit,  which  is  being
          developed by two rows of wells with the moving WOC. We knew:
          reservoir parameters and reservoir fluids and number of wells (Fig.
          3.9).


                                         45