
Page 90 - 6685
P. 90
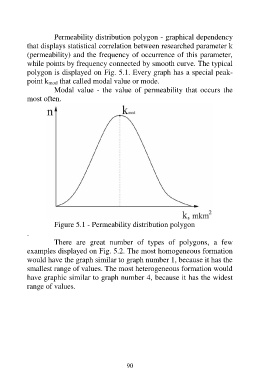
Permeability distribution polygon - graphical dependency
          that displays statistical correlation between researched parameter k
          (permeability) and the frequency of occurrence of this parameter,
          while points by frequency connected by smooth curve. The typical
          polygon is displayed on Fig. 5.1. Every graph has a special peak-
          point k mod that called modal value or mode.
                  Modal  value  -  the  value  of  permeability  that  occurs  the
          most often.


                  Figure 5.1 - Permeability distribution polygon
          .
                  There  are  great  number  of  types  of  polygons,  a  few
          examples displayed on Fig. 5.2. The most homogeneous formation
          would have the graph similar to graph number 1, because it has the
          smallest range of values. The most heterogeneous formation would
          have graphic similar to graph number 4, because it has the widest
          range of values.


                                         90