
Page 51 - 6685
P. 51
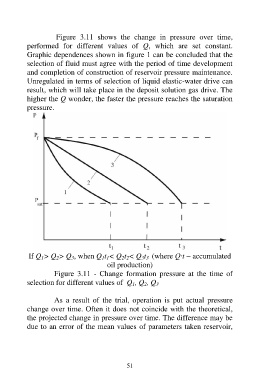
Figure 3.11 shows the change in pressure over time,
performed for different values of Q, which are set constant.
Graphic dependences shown in figure 1 can be concluded that the
selection of fluid must agree with the period of time development
and completion of construction of reservoir pressure maintenance.
Unregulated in terms of selection of liquid elastic-water drive can
result, which will take place in the deposit solution gas drive. The
higher the Q wonder, the faster the pressure reaches the saturation
pressure.
If Q 1> Q 2> Q 3, when Q 1t 1< Q 2t 2< Q 3t 3 (where Q·t accumulated
oil production)
Figure 3.11 - Change formation pressure at the time of
selection for different values of Q 1, Q 2, Q 3
As a result of the trial, operation is put actual pressure
change over time. Often it does not coincide with the theoretical,
the projected change in pressure over time. The difference may be
due to an error of the mean values of parameters taken reservoir,
51