
Page 70 - 4560
P. 70
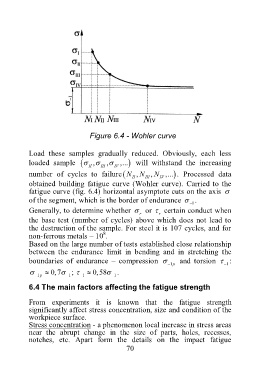
Figure 6.4 - Wohler curve
Load these samples gradually reduced. Obviously, each less
loaded sample , , ,... will withstand the increasing
II III IV
number of cycles to failure N , N , N ,... . Processed data
II III IV
obtained building fatigue curve (Wohler curve). Carried to the
fatigue curve (fig. 6.4) horizontal asymptote cuts on the axis
of the segment, which is the border of endurance .
1
Generally, to determine whether or certain conduct when
r r
the base test (number of cycles) above which does not lead to
the destruction of the sample. For steel it is 107 cycles, and for
8
non-ferrous metals – 10 .
Based on the large number of tests established close relationship
between the endurance limit in bending and in stretching the
boundaries of endurance – compression and torsion :
1p 1
0,7 ; 0,58 .
1p 1 1 1
6.4 The main factors affecting the fatigue strength
From experiments it is known that the fatigue strength
significantly affect stress concentration, size and condition of the
workpiece surface.
Stress concentration - a phenomenon local increase in stress areas
near the abrupt change in the size of parts, holes, recesses,
notches, etc. Apart form the details on the impact fatigue
70